States are required to report annually to the U.S. Dept. of Education (ED) the “4-Year Adjusted Cohort Graduation Rate (ACGR)” for all students and separately for many student subgroups, including students with disabilities. The ACGR was put into place in 2008 via Federal regulations to help bring uniformity to the way states calculate the high school graduation rate. Reporting began with the 2010-2011 school year. The ACGR was subsequently included in the Every Student Succeeds Act (ESSA) passed in 2015. It is also the subject of non-regulatory guidance released by ED in January 2017.
States are to report only those students who graduated with a “regular high school diploma” in four (or fewer) years. ESSA defines a “regular high school diploma” as the “standard high school diploma awarded to the preponderance of students in a State that is fully aligned with the State’s standards.”
The 4-Year ACGR for the 2016-2017 school year was released on January 24, 2019. Below is a report on the performance of students with disabilities during the seven years since ACGR reporting began. The ED guidance makes these important points regarding the ACGR for students with disabilities:
- A State may not include a recognized equivalent of a diploma as a regular high school diploma for the purpose of calculating the four-year or extended-year ACGR. (ESEA section 8101(43)(B)). Thus, students who graduate with a credential other than a regular high school diploma, such as a general equivalency diploma, modified diploma, certificate of completion, certificate of attendance, or a diploma based on meeting a student’s IEP goals, may not be counted in the numerator as having earned a regular high school diploma, but must be included in the denominator of the four-year and extended-year ACGR. (A-14) A diploma based on meeting IEP goals will not provide a sufficient basis for determining that the student has met a State’s grade-level academic content standards; rather, it will only demonstrate that the student has attained his or her IEP goals during the annual period covered by the IEP. Therefore, a diploma based on attainment of IEP goals, regardless of whether the IEP goals are fully aligned with a State’s grade-level content standards, should not be treated as a regular high school diploma.(A-15)
- States may count a student with the most significant cognitive disabilities who graduates with a State-defined alternate diploma in the cohort for a four-year ACGR within the time period for which the State ensures the availability of a free appropriate public education under section 612(a)(1) of the Individuals with Disabilities Education Act (IDEA)(A-7)
However, because the U.S. Congress invalidated the Federal regulations governing accountability under ESSA, some issues regarding the calculation of the ACGR remain unsettled. These include:
- How states determine who is a “student with a disability” for inclusion in the subgroup. Therefore, states may be determining who is included in a variety of ways (started the cohort with an IEP, exited the cohort with an IEP, etc.) This lack of clarity impacts the comparability of the ACGR for students with disabilities across states.
- How states count students with the most significant cognitive disabilities who graduate with a State-defined alternate diploma in the four-year and extended-year ACGR. Therefore, states may be using different methodologies for this purpose.
In comparing ACGRs across states, the substantial differences in the requirements for a regular high school diploma used by states must also be taken into consideration. A 2015 report by the National Center on Educational Outcomes examined the coursework and exit exam requirements for students with IEPs compared to those without IEPs. However, many states have made changes to their diploma requirements since this report was compiled. In other words, a regular high school diploma (as defined by ESSA) does not represent the same knowledge and skills across states nor does it necessarily indicate college and career readiness.
The ACGR plays an important role in the accountability plans that states are required to develop and implement required by ESSA. States must set long-term goals and measurements of interim progress for the ACGR including by subgroups.
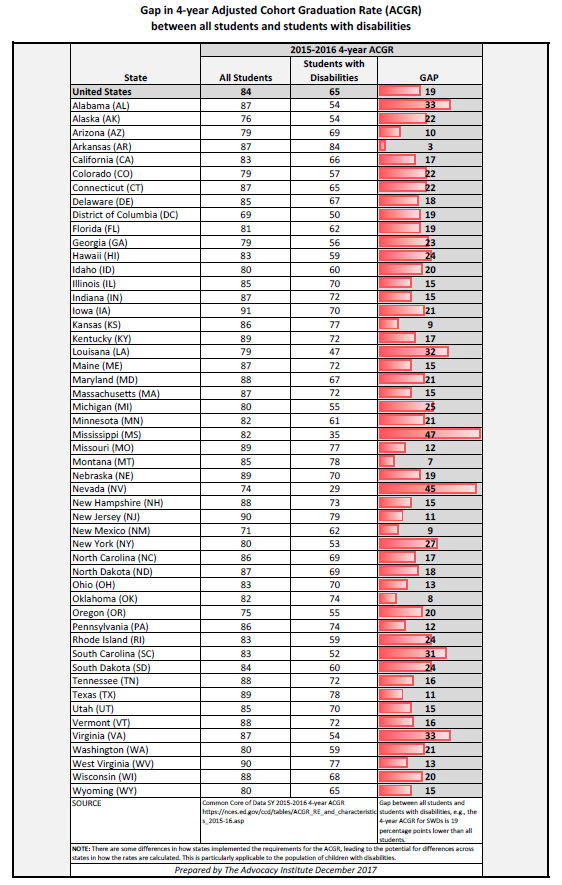
Download this chart here (PDF)
States reporting an ACGR more than 5 percentage points different (higher/lower) than the prior year for any subgroup are asked to provide an explanation for the increase/decrease to ED. The information submitted by such states appears at the end of this report.
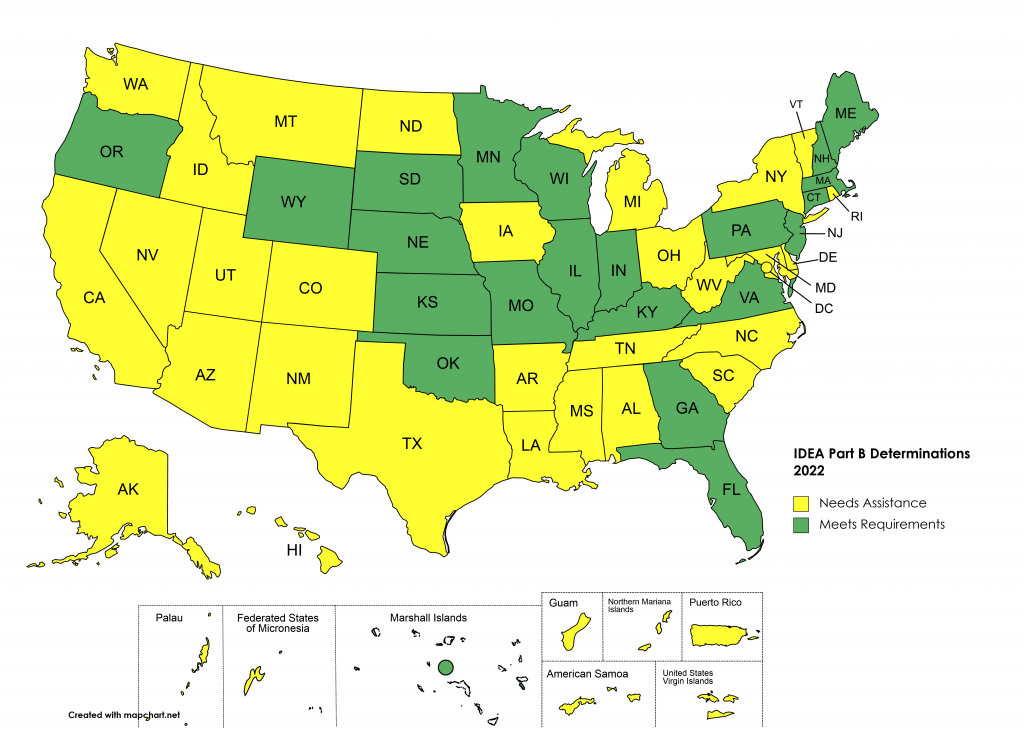
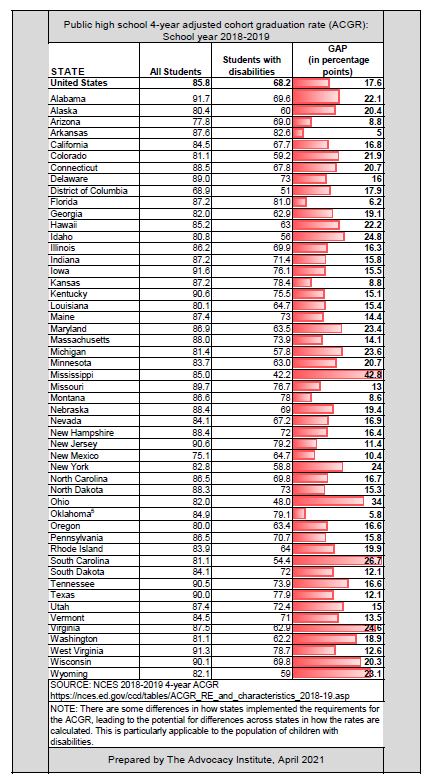
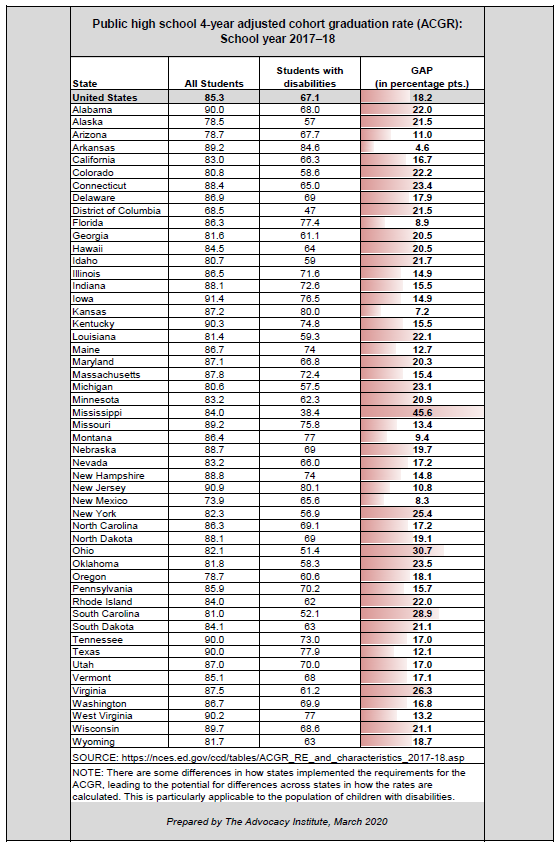
GAPS MATTER. While ACGR comparisons across states are difficult due to the issues discussed above, what is worth scrutiny is the GAP between students with disabilities and all students on the 4-year ACGR within each state. The table below provides the GAP for 2016-17 as well as the change in the GAP from the previous year. (Keep in mind that the GAP would be larger if it were possible to compare students with disabilities to those without disabilities.)
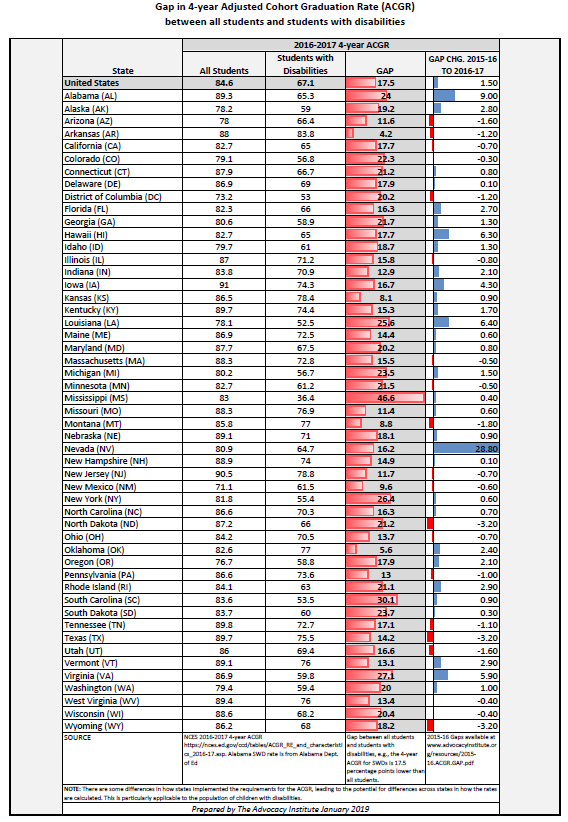
Download this chart here (PDF)
Below are the explanations provided to ED by states with substantial increase in their ACGR for students with disabilities from 2015-16 to 2016-2017 (excerpted from the ACGR Data Notes at https://www2.ed.gov/about/inits/ed/edfacts/data-files/index.html#acgr). LEA and school level ACGR data are also available.
Alabama: Alabama did not report ACGR data to ED for several subgroups including students with disabilities nor did the state respond to ED’s inquiry regarding the substantial difference in graduation rate for many subgroups including students with disabilities. After a review of its data, Alabama announced a revised graduation rate. See this news story.
Alaska: Alaska’s requirement that all graduates receive a valid score on a College and Career Ready Assessment was repealed on June 30, 2016. Graduation rates may have increased more than expected due to the elimination of this requirement.
Florida: The state indicated that data were correct as reported.
Hawaii: The state indicated that data were correct as reported.
Louisiana: No response
Nevada: The degree to which the change in graduation rate requirements caused the dramatic increase in rates across the state and within subgroups is difficult to accurately attribute as increase could also be the result of education reform initiatives enacted over the past several years. This being said, one policy action by the SEA is likely to have contributed significantly to the increase. This change was that students in the class of 2017 were the first students who did not have to earn a passing score on a high school state assessment for over a decade.
As the NDE considered a policy change for requirements to earn a regular high-school diploma, an analysis was conducted of the graduation rate trends for subpopulations. For students with disabilities, the graduation rate with a regular diploma had grown incrementally from 23% in FFY2005 to 28% in FFY2014. When students with disabilities were unable to pass each section of the high-stakes graduation examination, despite earning required credits, they earned adjusted diplomas. Adjusted diplomas accounted for approximately 32% of diplomas issued. After the policy was changed to no longer require students to pass a high-stakes examination to earn a regular diploma, there was an increase in the rate of students with disabilities earning a regular diploma that was comparable to the rate of students who previously earned adjusted diplomas. These data support an inference that the growth in the regular diploma graduation rate for students with disabilities is the result of the policy change to no longer require students to pass a high-stakes examination.
Virginia: The divisions that increased had more standard and advanced diplomas (which count towards the federal graduation rate), and the ones that decreased had an increase in dropouts.
Related articles:
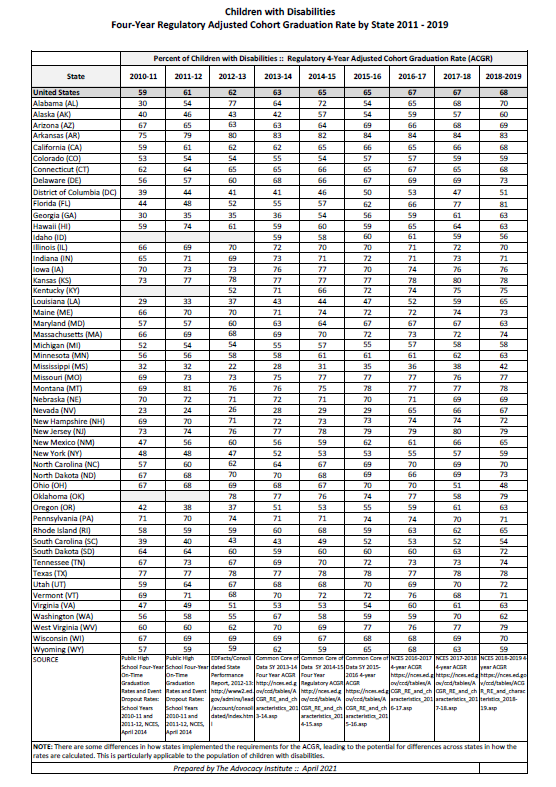
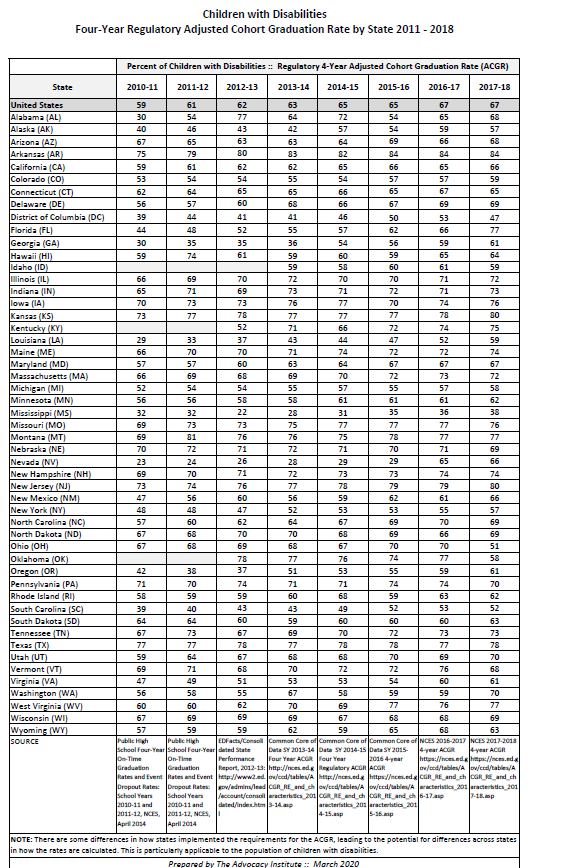
Graduation Rates for Students with Disabilities: 6 Years (2010-2015)
Graduation Gaps for Students with Disabilities: 2015-2016
Diploma Options, Graduation Requirements, and Exit Exams for Youth with Disabilities: 2017 National Study (National Center on Educational Outcomes, 2019)
Study Finds Wide Variation in Graduation Rates for Students with Disabilities; Little Relationship with Graduation Policies (2015)
Graduation Issues and Considerations for Students with Disabilities Webinar presented by The Advocacy Institute and the National Center on Educational Outcomes (archived recording) Webinar Handout (PDF)
Diplomas that Matter: Ensuring Equity of Opportunity for Students with Disabilities (Achieve, 2016)
Almost all students with disabilities are capable of graduating on time. Here’s why they’re not (Hechinger Report, 2017)