Archive for October, 2015

TUDA Spells Tough Times for Students with Disabilities in Many Large Urban Districts

Friday, October 30th, 2015

Along with the results of the 2015 NAEP for states and the nation, the results of the 2015 TUDA – the Trial Urban District Assessment were released on October 28, 2015. (We blogged about the release of the NAEP at the state and national levels earlier.)

The TUDA reports the reading and math achievement of public school students in 21 urban districts at grades 4 and 8. Results are broken down by racial/ethnic groups as well as special populations, such as students with disabilities and students eligible for free/reduced-price lunch meals. The TUDA was established in 2002 to support the improvement of student achievement in the nation’s large urban districts. Districts eligible to participate in the TUDA assessments must be large cities with a population of 250,000 or more in addition to having a majority (50 percent or more) of their student population being Non-White (Black or Hispanic) or eligible for the National School Lunch program. Students in the TUDA districts represent nearly one-half of the students who attend schools in large cities nationally.

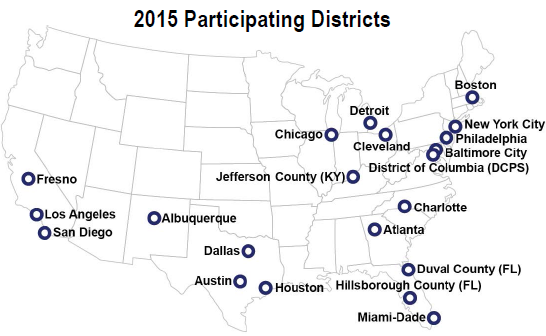
The districts that participated in the 2015 TUDA are shown in the map below.

Districts participating in 2015 NAEP TUDA

Map reads: 2015 Participating Districts were Albuquerque, Atlanta, Austin, Baltimore City, Boston, Charlotte, Chicago, Cleveland, Dallas, Detroit, District of Columbia (DCPS), Duval County (FL), Fresno, Hillsborough County (FL), Houston, Jefferson County (KY), Los Angeles, Miami-Dade, New York City, Philadelphia and San Diego.

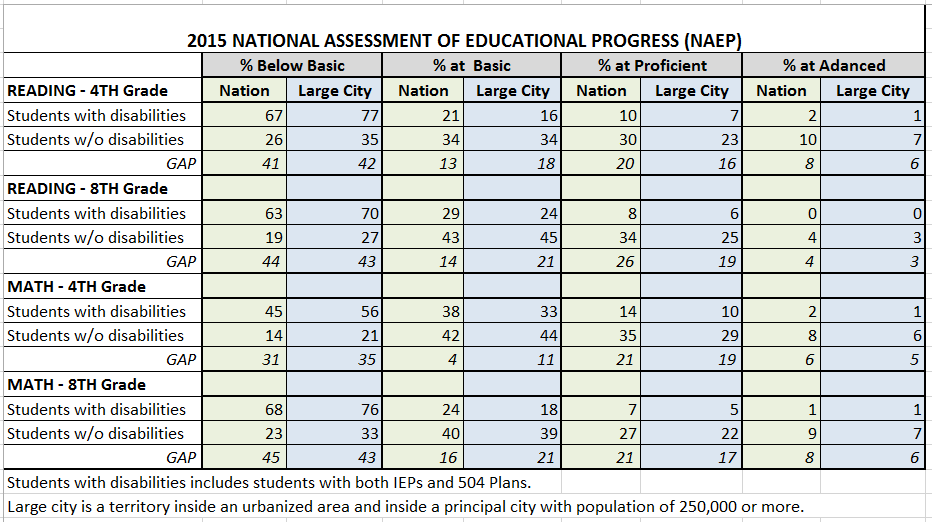
The achievement of students with disabilities (which includes students with IEPs and 504 Plans) varied substantially across the 2015 TUDAs. The nationwide achievement levels and the Large City achievement levels appear in the table below.

NAEP 2015 Achievement levels of students with and without disabilities nationwide and large city

HIGH PERFORMING DISTRICTS. When comparing the achievement of students with disabilities in the TUDAs to that of Large Cities, a few districts stand out as doing exceptionally well. In Reading, these districts are Duval County (FL), Hillsborough County (FL) and Miami-Dade (FL). In Math, these districts are Austin, Boston, Duval County (FL), Hillsborough County (FL) and Miami-Dade (FL).

POOR PERFORMING DISTRICTS. When comparing the achievement of students with disabilities in the TUDAs to that of Large Cities, a few districts stand out as exceedingly poor performers. In Reading, these districts are Albuquerque, Baltimore City, Cleveland, Detroit, Los Angeles, and Philadelphia. In Math, these districts are Albuquerque, Atlanta, Baltimore City, Chicago, Cleveland, Detroit, Fresno, Los Angeles, and Philadelphia.

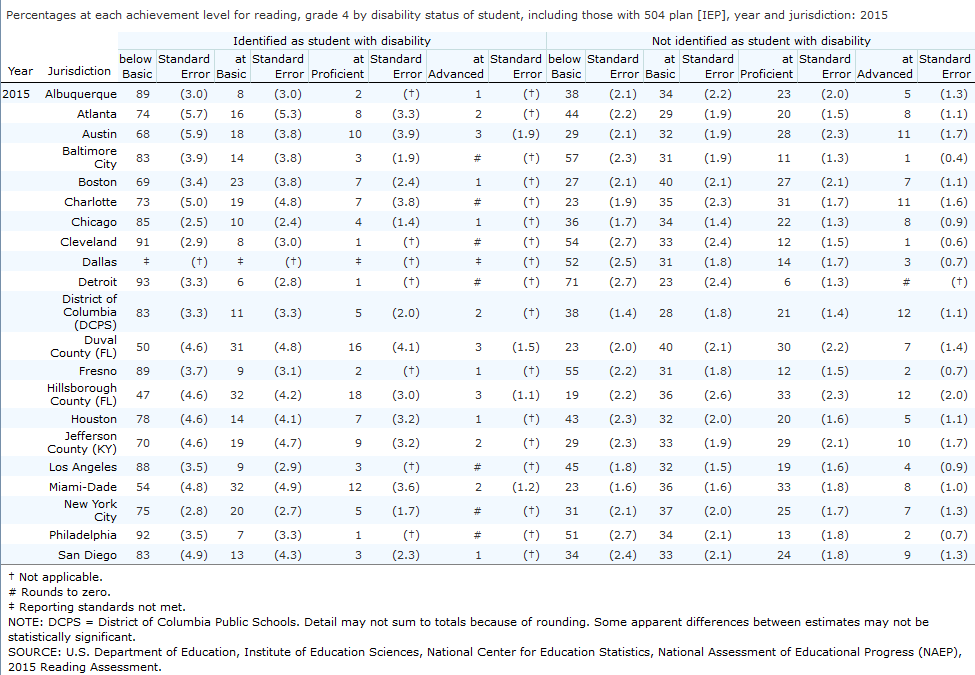
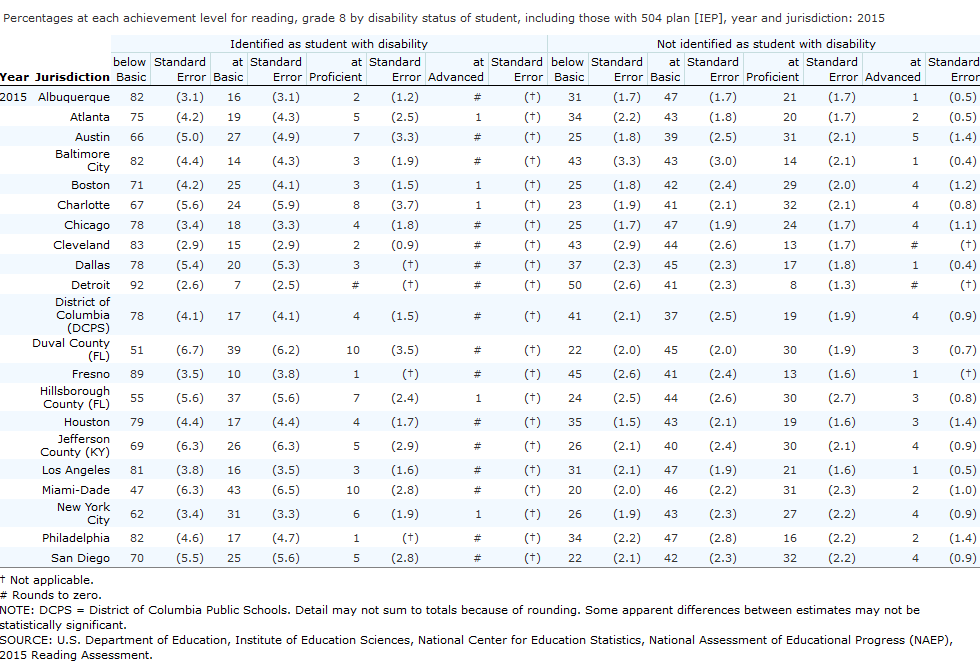
The performance of students with disabilities compared to those without disabilities in each of the participating districts is shown below.

READING GRADE 4 (Click here to view this table as a chart)


TUDA 2015 Reading Grade 4 Students with Disabilities and students without disabilities

READING GRADE 8 (Click here to view this table as a chart)


TUDA Reading Grade 8 2015 students with disabilities and without disabilities

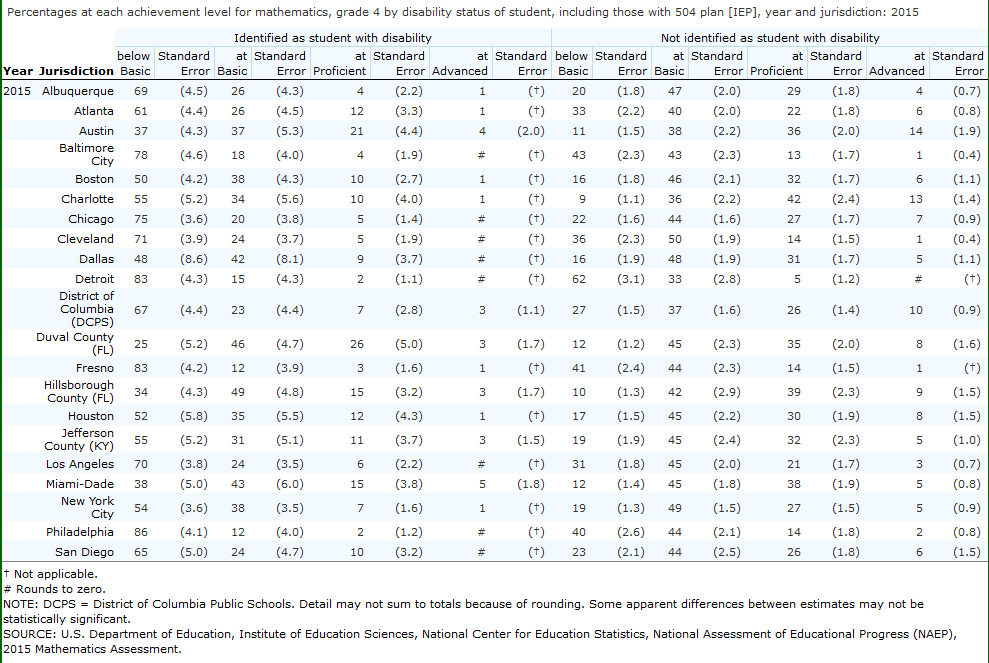
MATH GRADE 4 (Click here to view this table as a chart)


TUDA 2015 Math Grade 4 students with and without disabilities

MATH GRADE 8 (Click here to view this table as a chart)


TUDA 2015 Math Grade 8 students with and without disabilities


SEE ALSO: Blog on 2013 TUDA
2015 NAEP Shows Little Change for Students with Disabilities

Thursday, October 29th, 2015

Results of the 2015 National Assessment of Educational Progress (NAEP) in Reading and Mathematics were released October 28, 2015. Details are available here.

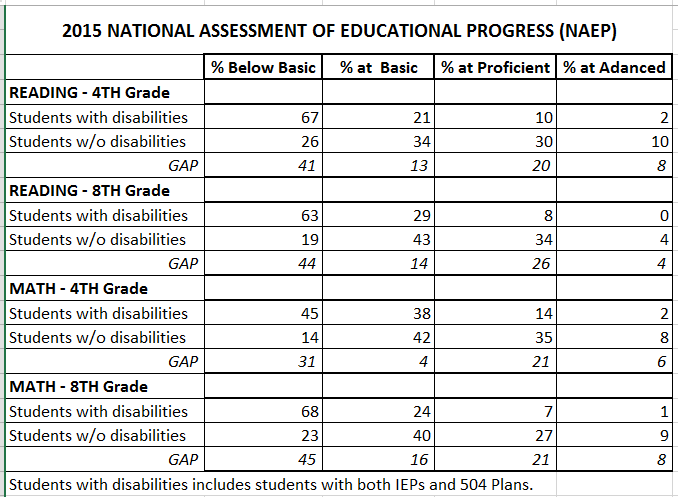
As in recent years, the 2015 performance of students with disabilities showed little if any improvement over the last three administrations (2009-2011-2013) and the gaps between students with disabilities and those without disabilities continue to be substantial. The majority of students with disabilities performed in the “below basic” achievement level in all areas except 4th grade Math. See table below.

NAEP 2015 Achievement levels SD vs. No SD

However, there has been a substantial improvement in the rate of exclusion of students with disabilities, i.e., the percentage of students with disabilities selected to participate in the sample who were not tested. This practice was addressed by a resolution of the National Assessment Governing Board in 2010. The resolution sought to have students with disabilities participating at a rate of at least 85% in every state. As a result, exclusion rates have plummeted, as shown in the table below. This high rate of participation makes the NAEP results for students with disabilities more representative of the group as a whole. (Details on exclusion rates by state on each NAEP assessment are available here.)

NAEP participation was also addressed by the US ED Office of Special Education Programs in 2014 when it began including NAEP participation and performance in the determination for each State under section 616(d) of the Individuals with Disabilities Education Act (IDEA).

The table below shows the rates of exclusion in NAEP administrations from 2003-2015.

NAEP exclusion rates for students with disabilities

In fact, the significant improvement in testing students with disabilities was noted by U.S. Education Secretary Arne Duncan as possibly causing overall declines in Maryland, as reported in the Baltimore Sun “U.S. Secretary of Education Arne Duncan noted to Maryland and Baltimore’s large declines, but said the drops were “good news” because they reflected the state’s efforts to be more inclusive of certain populations — such as students with disabilities and English Language Learners.” 

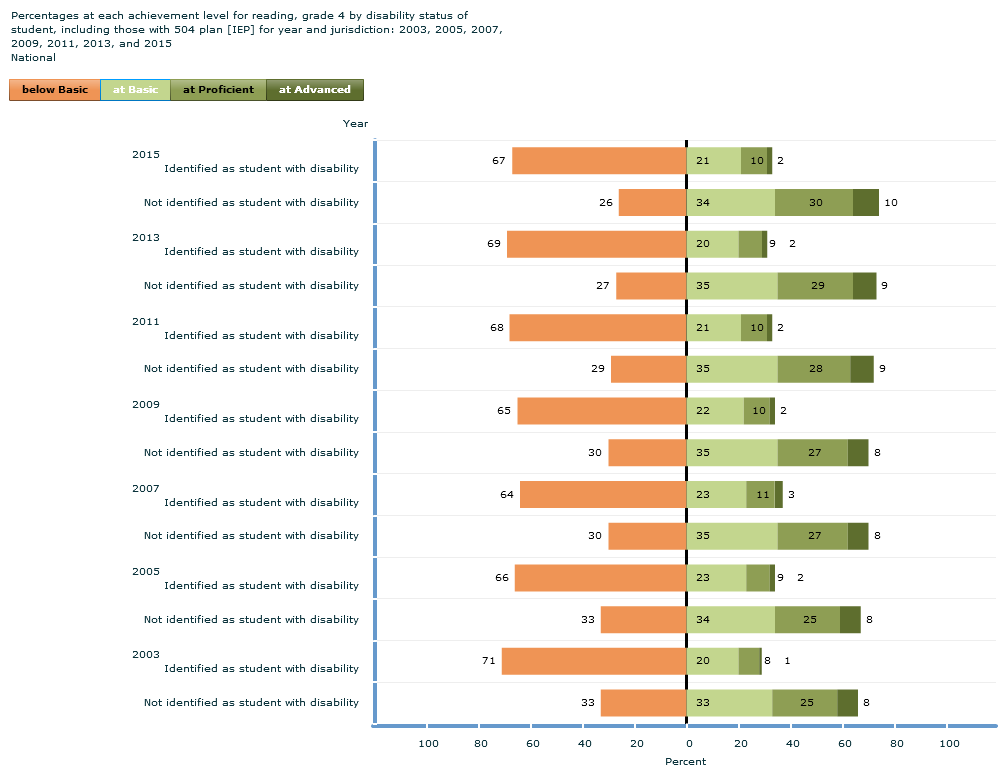
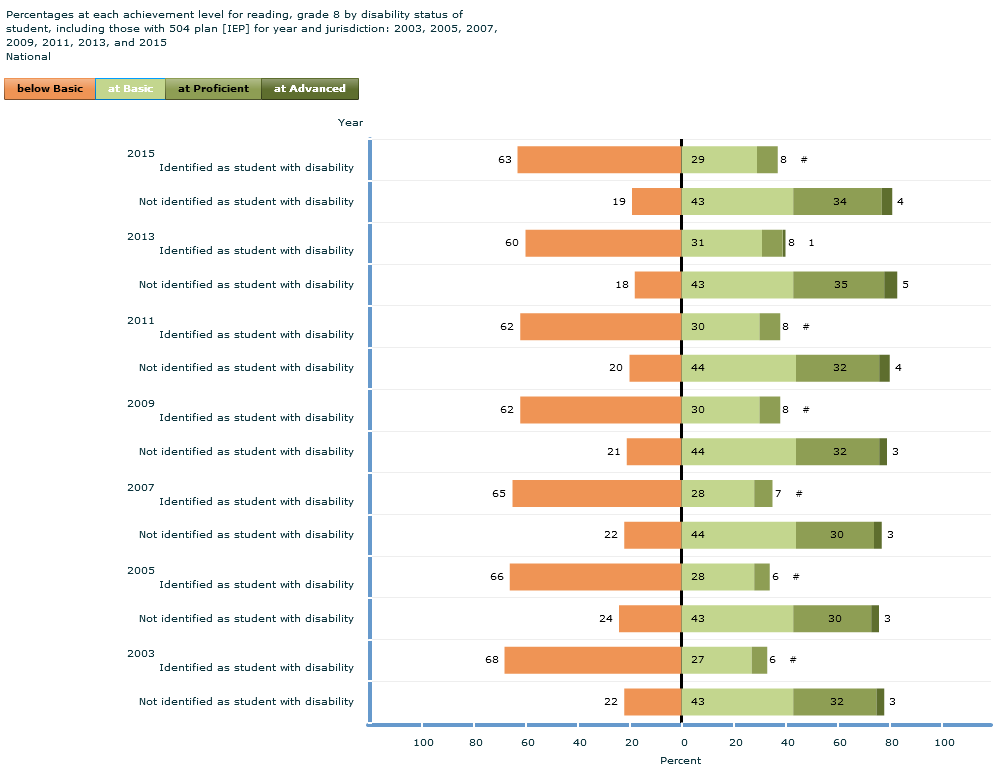
Below are achievement levels for students with disabilities and students without disabilities in each NAEP area from 2003 through 2015.

READING – GRADE 4

NAEP Reading Grade 4 achievement levels for students with disabilities 2003-2015

READING GRADE 8

NAEP Reading Grade 8 achievement levels students with disabilities 2003-2015

 MATH GRADE 4

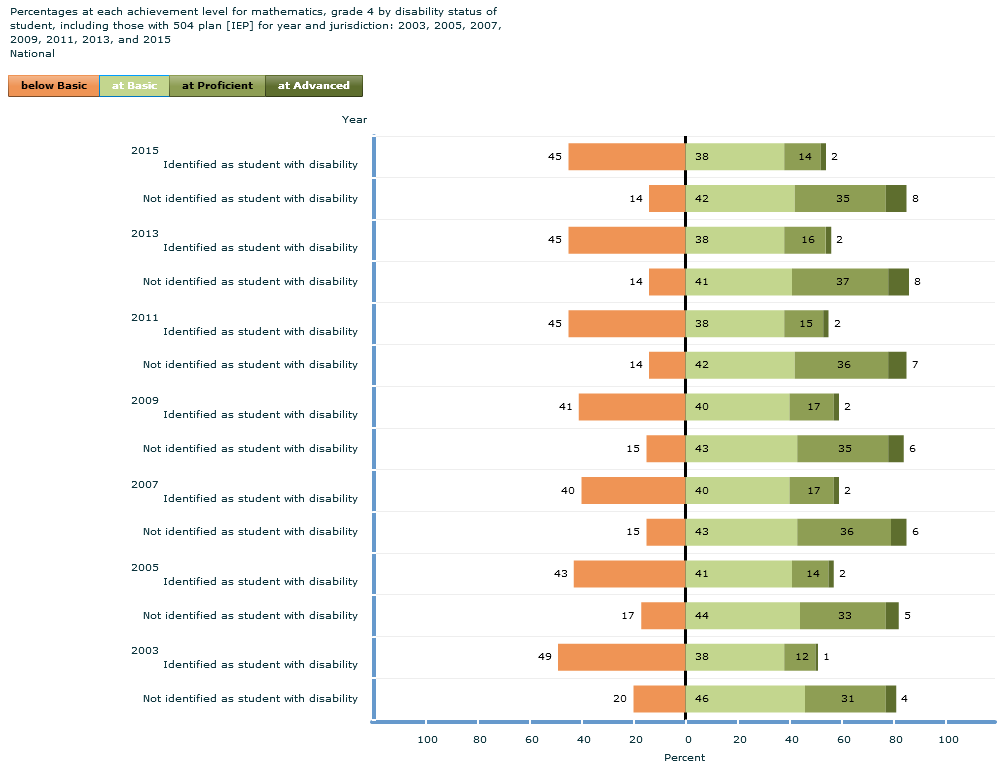
NAEP Math Grade 4 achievement levels students with disabilities 2003-2015

MATH GRADE 8

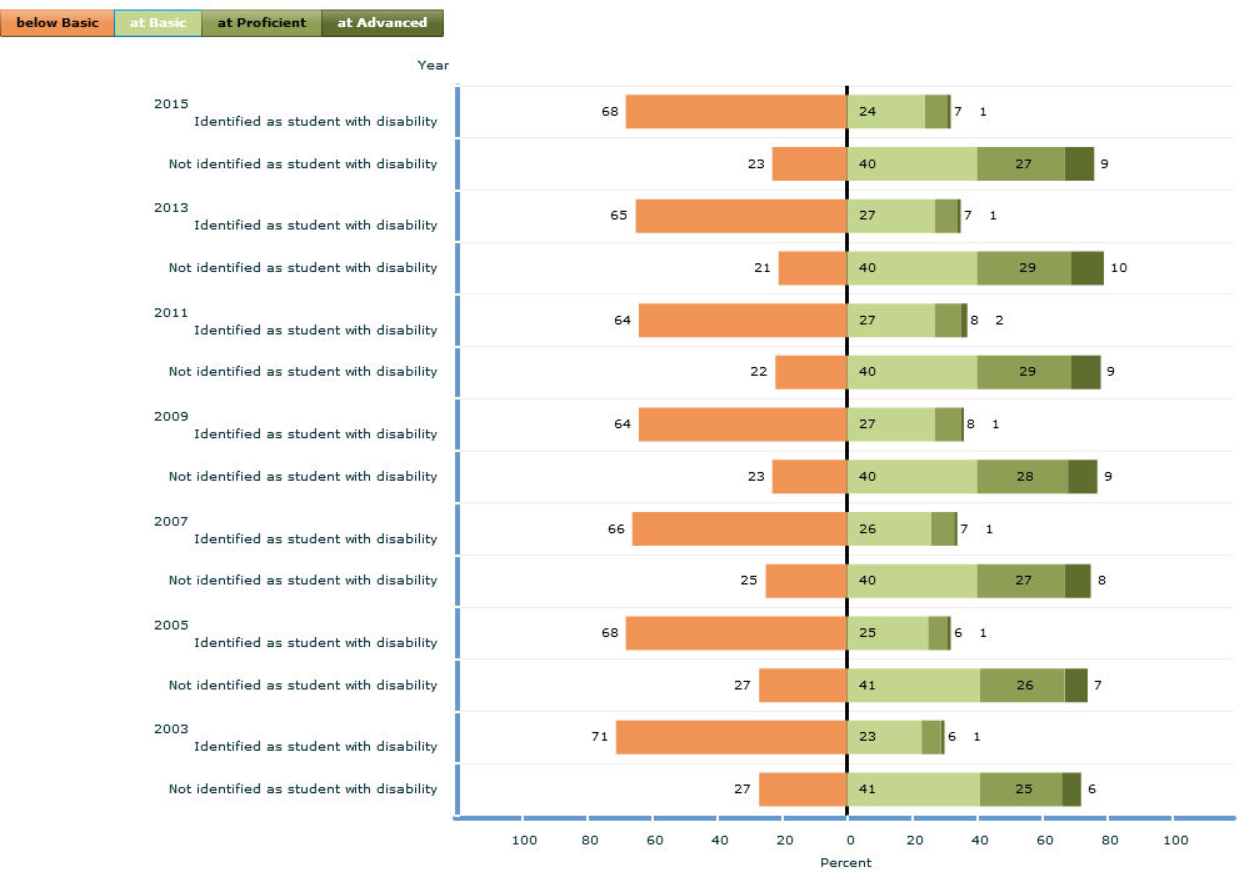
NAEP Math Grade 8 achievement levels students with disabilities 2003-2015


See also: Our reports on 2015 TUDA and 2013 NAEP results.

New ACGR Data Show Graduation Gaps Persist

Wednesday, October 21st, 2015

On October 19, 2015, the U.S. Dept. of Education (ED) released preliminary graduation rates reported by states for the 2013-14 school year.

According to ED “The vast majority of states – 36 – saw increases in overall graduation rates, while 6 states saw decreases and another 8 saw no change since 2012-13. The majority of states also shrank the achievement gap for black and Hispanic students, as well as students with disabilities, English language learners and low-income students”

ED reported that 21 states showed a decline in the graduation rate gap between all students and students with disabilities, 17 states had increases in the gap and 12 states showed no change.

Our analysis (below) found 21 states and D.C. decreased, 15 increased and 14 had no change (the difference could be caused by rounding). Two states are outliers  – Alabama (19 point gap increase) and Oregon (gap decrease of 11 points).

Most states had negligible changes (a decrease or increase of just 1-2 points) which could be characterized as statistically insignificant.

Without a doubt, the bigger issue continues to be the huge gaps between students with disabilities and all students earning a regular high school diploma in four years.

Four Year Adjusted Cohort Graduation Rate
Gaps between All Students and Students with Disabilities
SY 2012-13 and SY 2013-14

Download ACGR Comparison Chart .

See also: Study Finds Wide Variation in Graduation Rates for Students with Disabilities; Little Relationship with Graduation Policies