How the States Stack Up: 2026 IDEA State Determinations
JUNE 23, 2026. The U.S. Dept. of Education (ED) Office of Special Education Programs (OSEP) has released the annual IDEA state determinations for 2026. The OSEP Fact Sheet on 2026 determinations is here.
The Individuals with Disabilities Education Act (IDEA) requires ED to annually assign every state a “rating” on its implementation of IDEA, based on the state’s performance on its State Performance Plan (SPP). The 2026 determinations are based on performance for fiscal year 2024. Each state is assigned one of the following ratings:
– Meets requirements and purposes of IDEA Part B
– Needs assistance in implementing the requirements of IDEA Part B
– Needs intervention in implementing the requirements of IDEA Part B
– Needs substantial intervention in implementing the requirements of IDEA Part B
See How the Department Made Determinations for details.
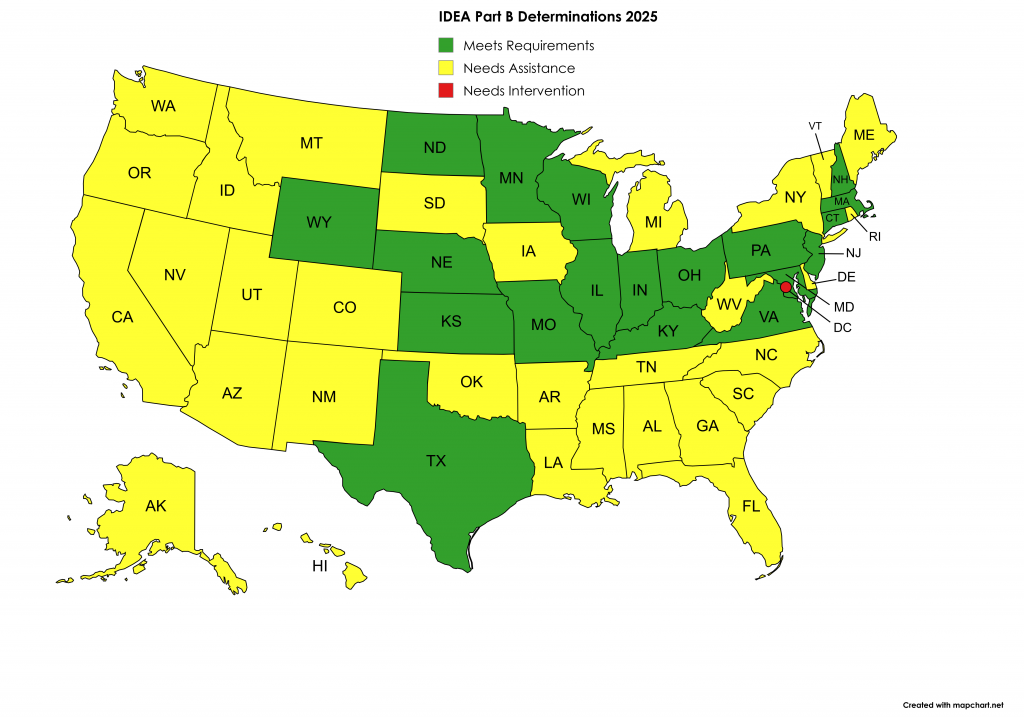
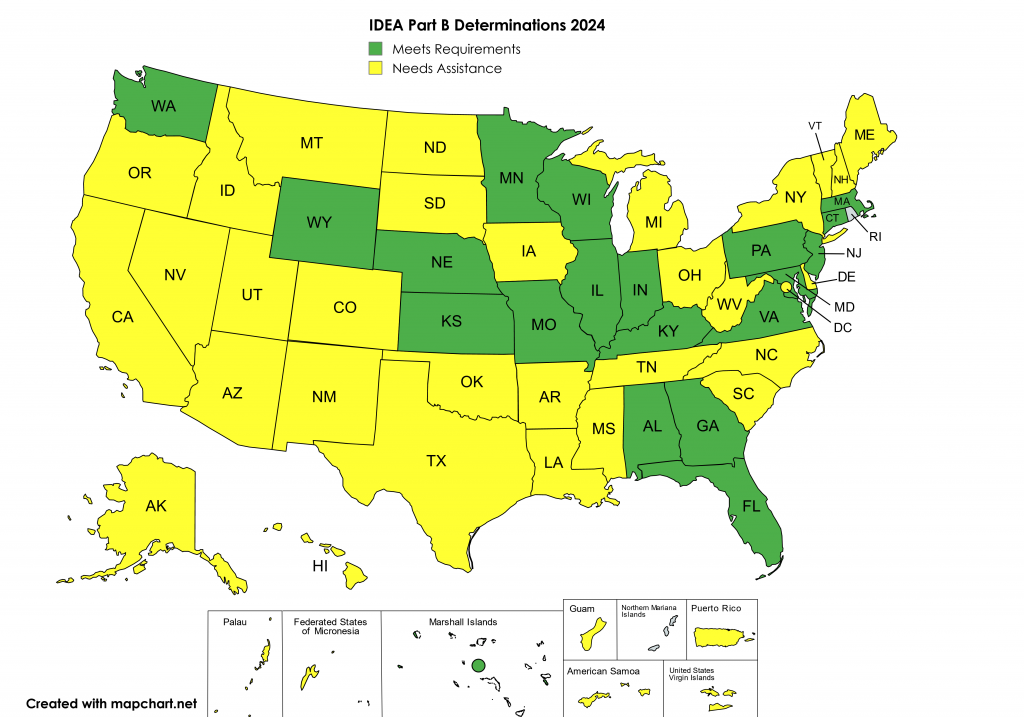
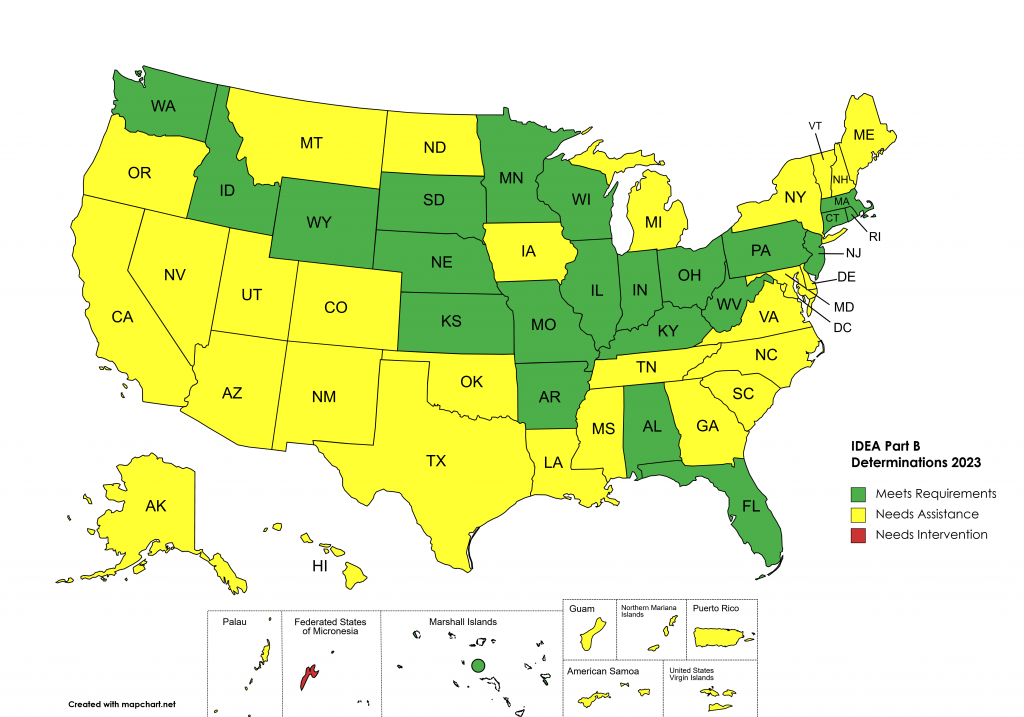
The map below shows the 2026 determination for each state.
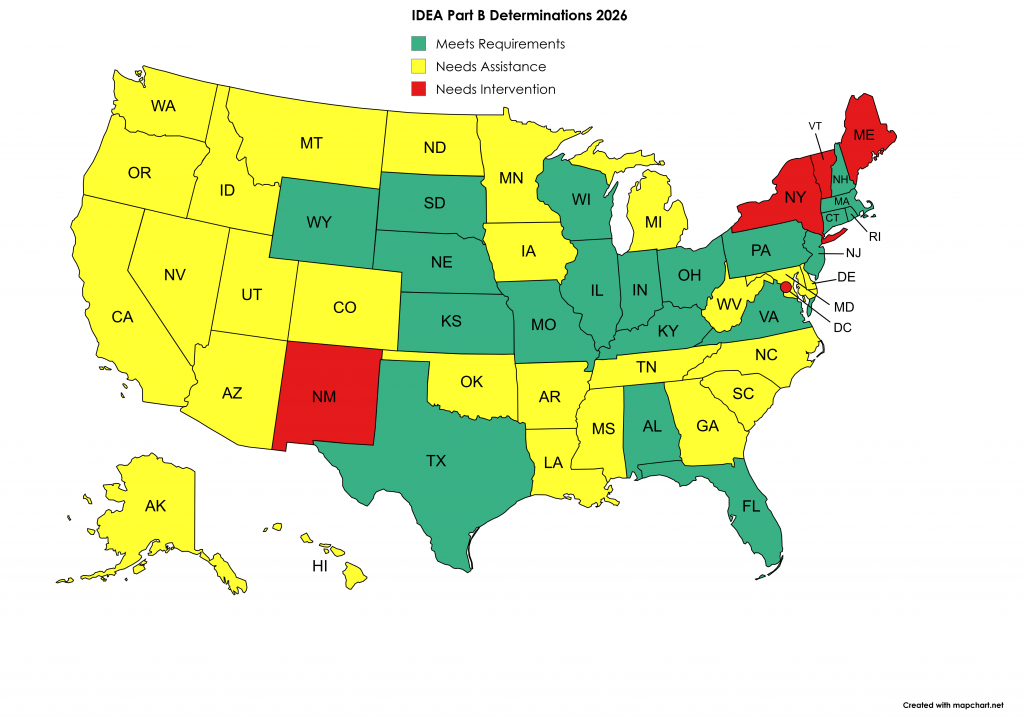
Changes from 2025 Determinations
- Rating improved for 4 states: AL, FL, RI, SD
- Rating dropped for 7 states: ME, MD, MN, NM, NY, ND, VT
- Just 5 states have received a “Meets Requirements” rating each of the past 13 years (2014-2026): KS, MA, MO, PA, WI.
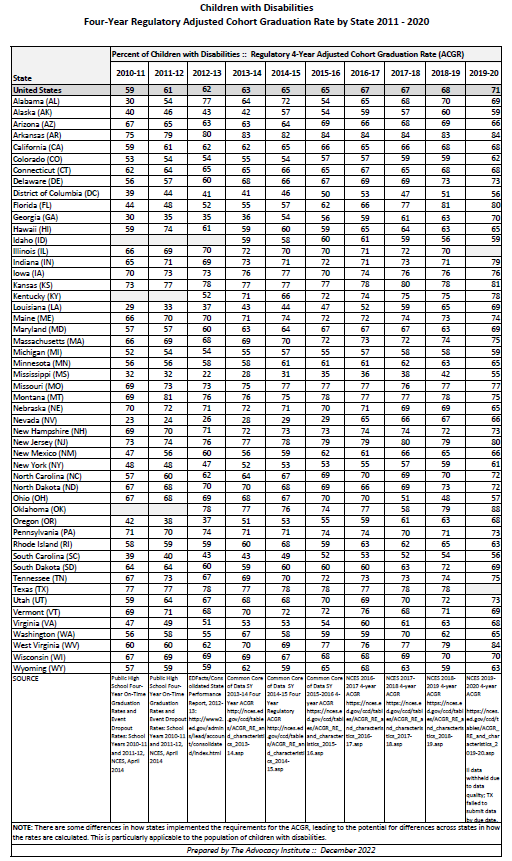
Get annual determinations by state for 2014 to 2026 here. (PDF, 1 pg.)
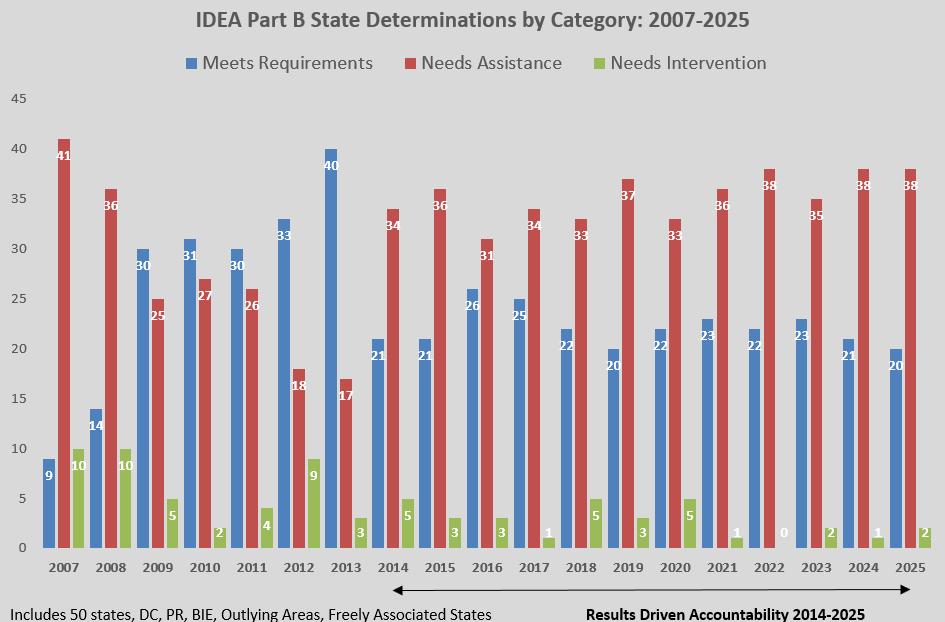
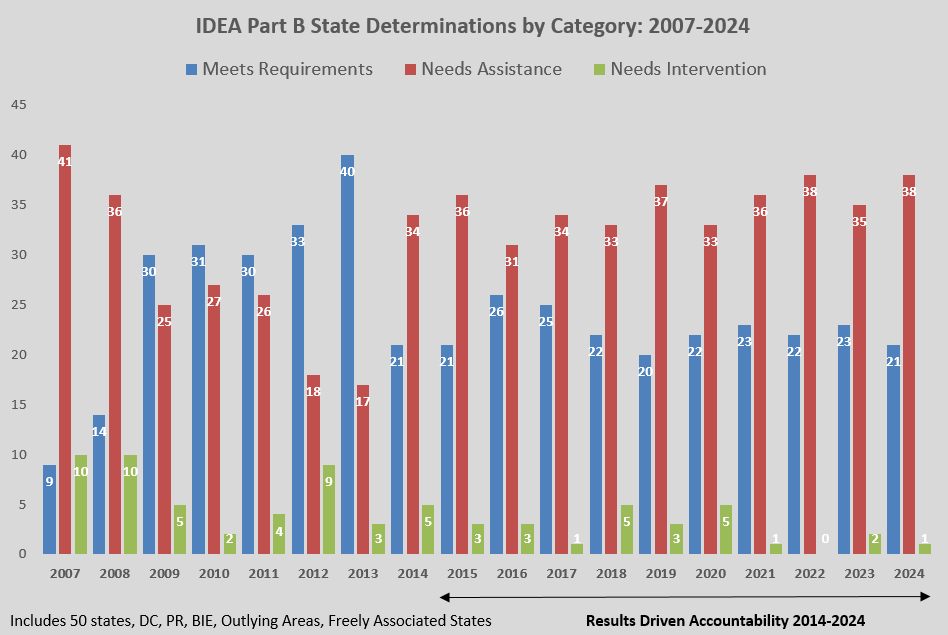
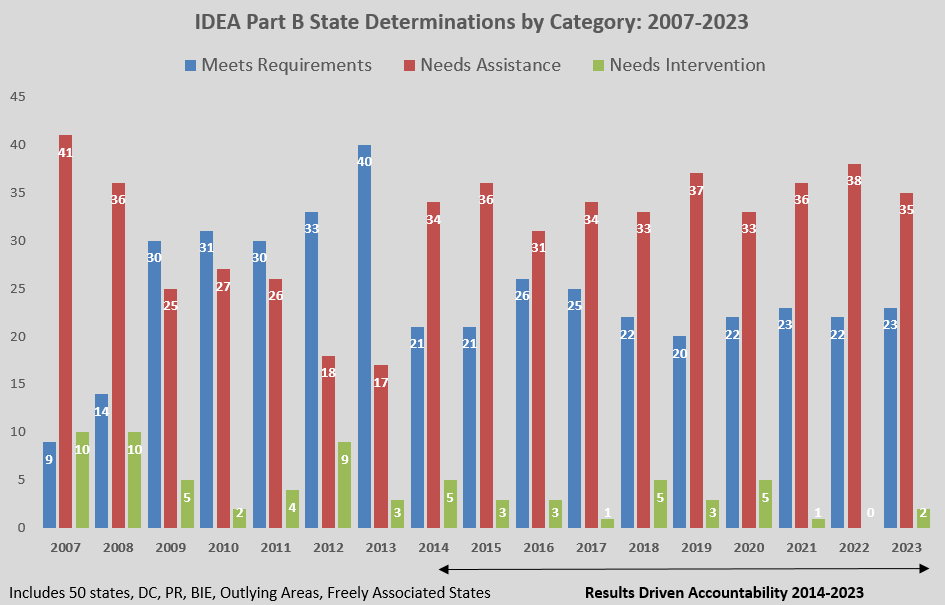
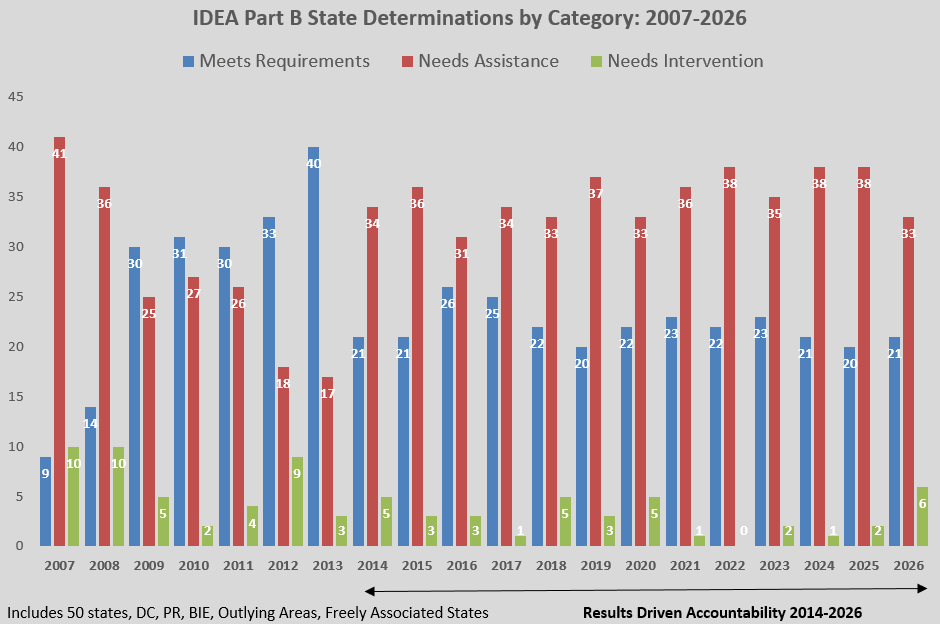
Beginning in 2014, OSEP began using the “Results-Driven Accountability” (RDA) Matrix to arrive at state determinations. Under the RDA determinations matrix, it is mathematically impossible for all states to achieve a “Meets Requirements” rating due to the heavy use of scoring based on rank-ordering of states. Consequently, as the chart below shows, the number of states earning a “Meets Requirements” rating has changed little under RDA.
See also:
The Advocacy Institute comments to OSEP regarding RDA (Oct. 2022)(PDF)
How the states Stack Up:
2025 IDEA State Determinations
2024 IDEA State Determinations
2023 IDEA State Determinations
2022 IDEA State Determinations
2021 IDEA State Determinations
2020 IDEA State Determinations