
2019 National Assessment of Educational Progress (NAEP)
Performance of Students with Disabilities by State
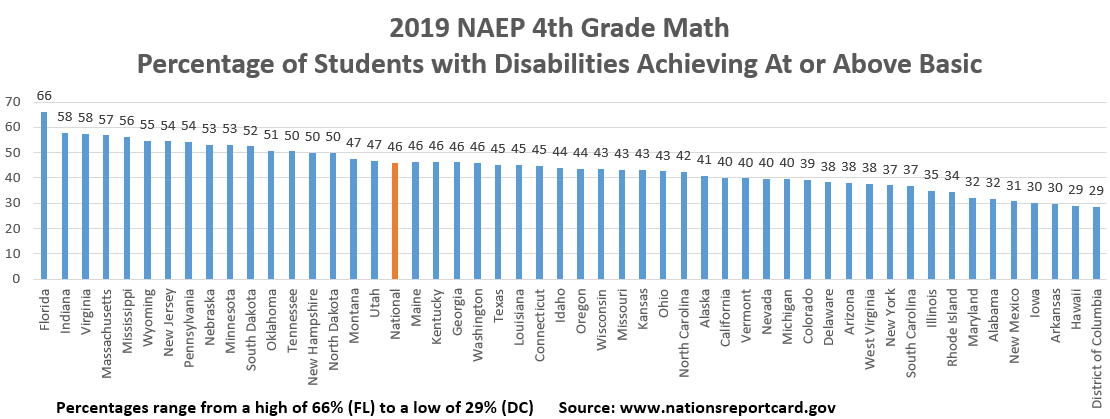
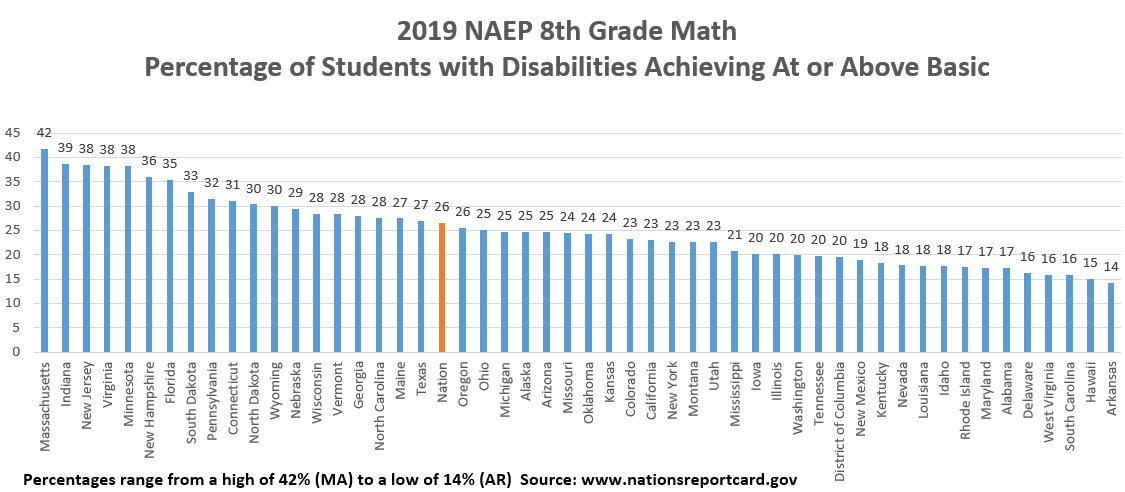
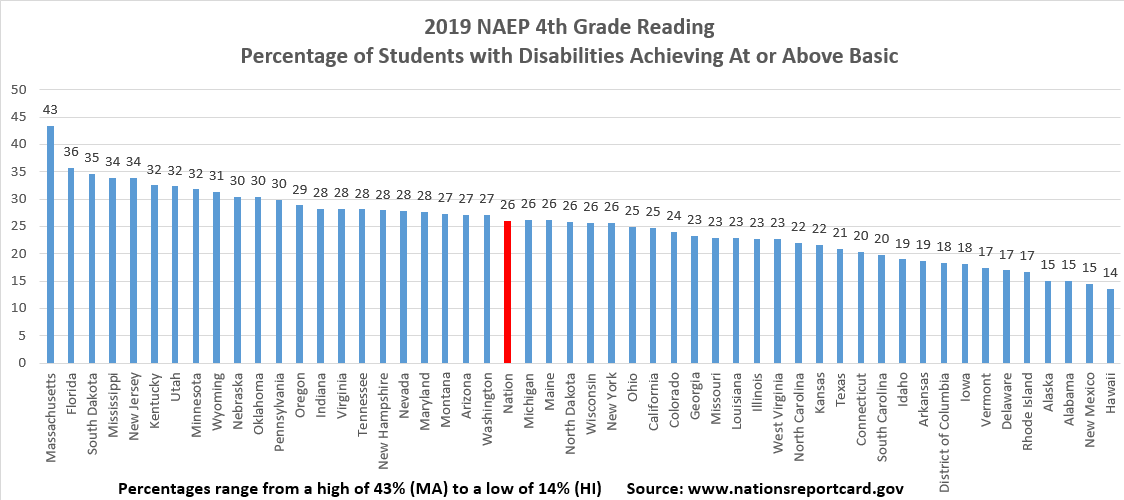
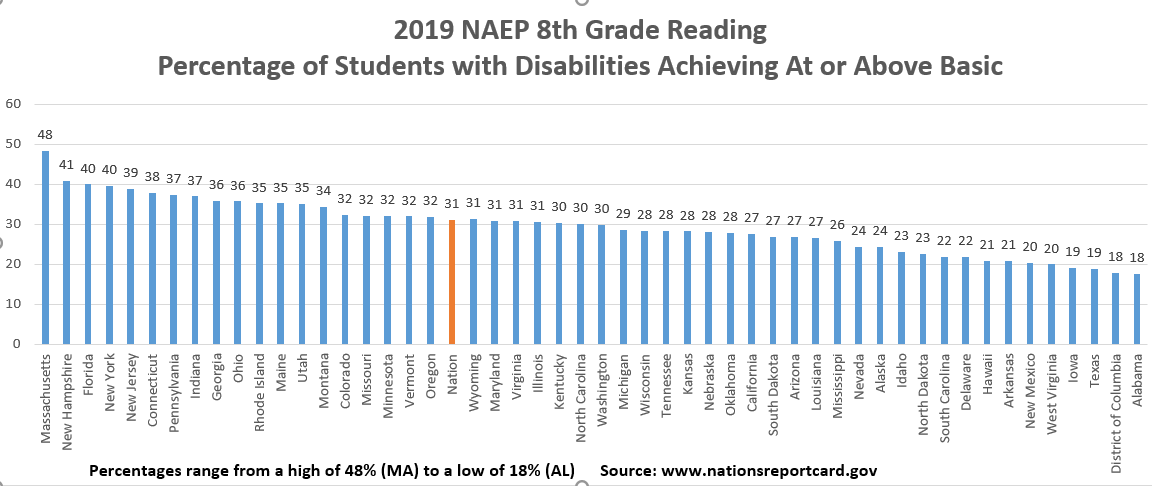
Below is the percentage of students with disabilities (students with IEPs) scoring at Basic or above
(e.g., percentage scoring at Basic, Proficient, and Advanced) on 4th and 8th grade math and reading.
Participation. Participation in NAEP is judged based on the percentage of the selected students with disabilities who took the assessment.
States with participation rates below 85% in the 2019 NAEP appear below. These states are, however, listed by NAEP as having a rate higher than or not significantly different from the goal of 85% when taking into account standard error estimates.
| Math |
Reading |
| 4th Grade |
8th Grade |
4th Grade |
8th Grade |
Texas (79%)
Washington (83%)
|
Louisiana (83%)
Michigan (82%)
|
California (82%)
Maryland (84%)
Texas (77%)
|
Georgia (81%)
Louisiana (77%)
Maryland (84%)
Michigan (84%)
Tennessee (82%)
Texas (83%)
|
Sources: 2019 Reading and Math Grades 4 and 8 Assessment Report Cards: Summary Data Tables for National and State Sample Sizes, Participation Rates, Proportions of SD and ELL Students Identified, and Types of Accommodations available here. |