What is NAEP and Why is it important?
NAEP Results for Students with Disabilities :: National
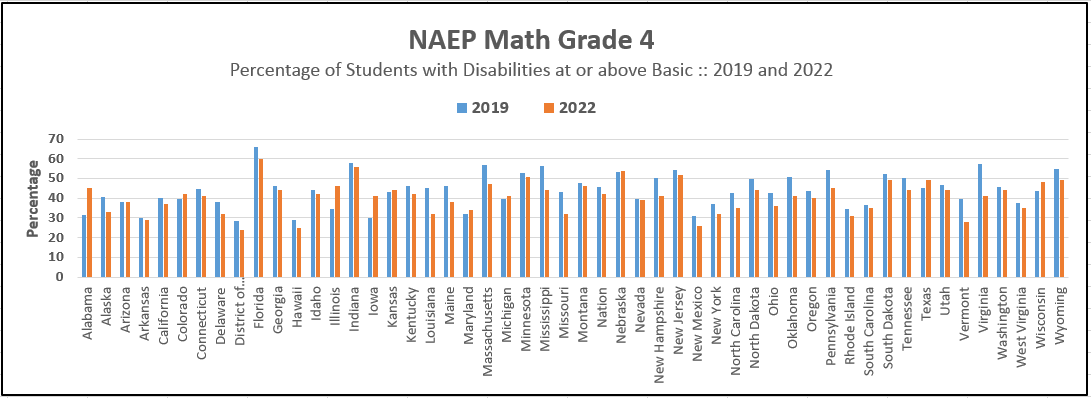
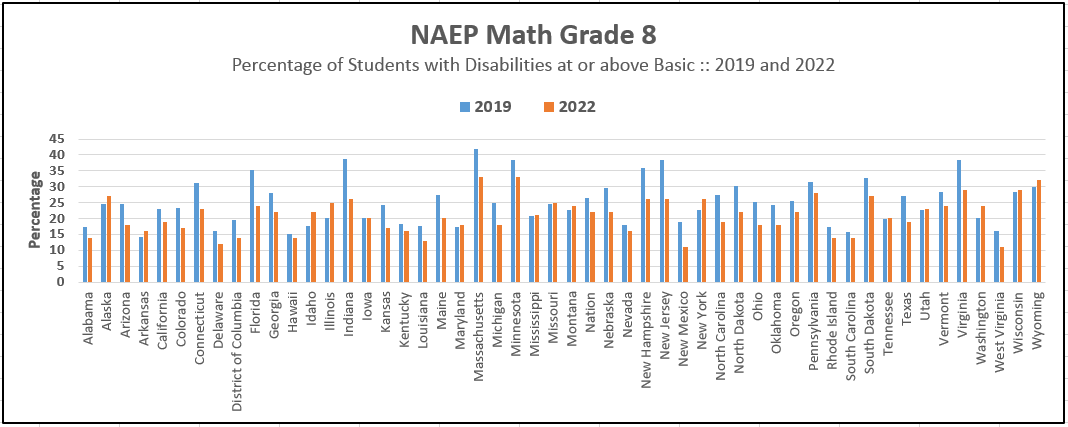
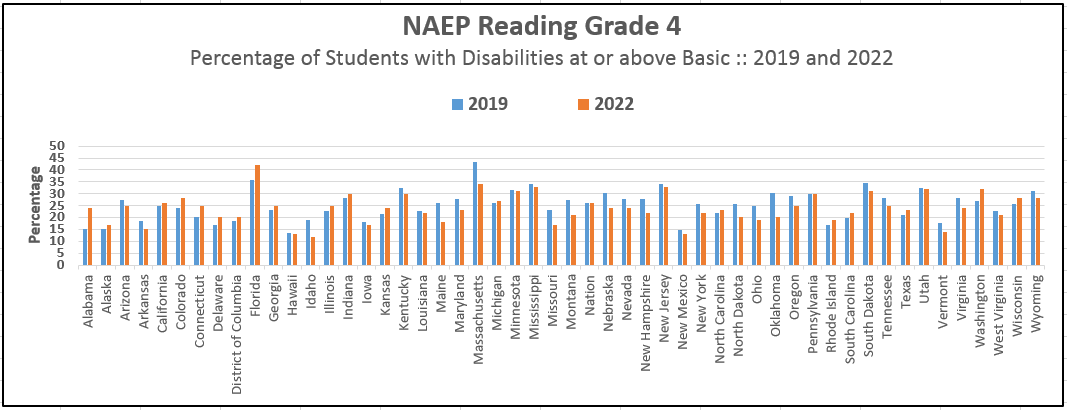
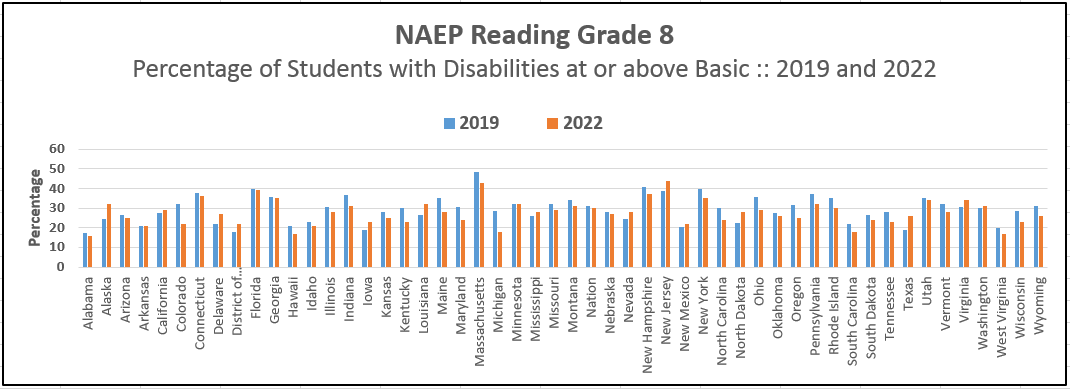
2022-2019NAEP Results for Students with Disabilities by State ::
2019 vs. 2022NAEP Results for Students with Disabilities by Race/Ethnicity :: National 2022
NAEP Results for Students with Disabilities :: National
2019-2017-2015NAEP Results for Students with Disabilities :: National
2017-2015-20132022 NAEP Results for Students with Disabilities :: Rank-ordered by State
2019 NAEP Results for Students with Disabilities :: Rank-ordered by State
2017 NAEP Results for Students with Disabilities :: Rank-ordered by State
|
||