State High School Exit Exams and Students with Disabilities:
How Are They Doing?
The Center on Education Policy (CEP) released its 9th annual report on high school exit exams, State High School Tests: Exit Exams and Other Assessments, in December 2010. For purposes of its report, CEP identifies "states with high school exit exams" as:
- States that require students to pass, not just take, state exit exams to receive a high school diploma, even if the students have completed the necessary coursework with satisfactory grades.
- States in which the exit exams are a state mandate rather than a local option, in other words, states that require students in all school districts to pass exit exams, rather than allowing districts to decide for themselves whether to make the exams a condition of graduation.
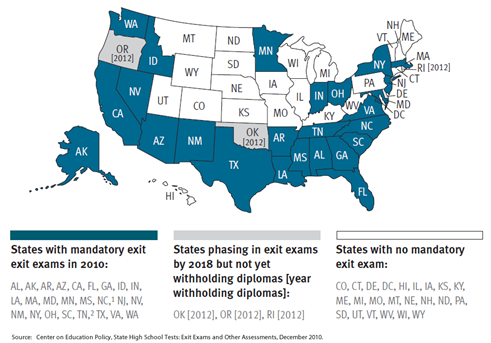 The 2010 CEP report finds that 28 states (see map at left) required high school exit exams in the 2009-10 school year (up from 26 in 2009). The percentage of public school students enrolled in states administering exit exams has now reached 74%. Meanwhile, tightening education budgets at both the state and local levels are impacted funding for programs related to high school exit exams, such as remediation services. The 2010 CEP report finds that 28 states (see map at left) required high school exit exams in the 2009-10 school year (up from 26 in 2009). The percentage of public school students enrolled in states administering exit exams has now reached 74%. Meanwhile, tightening education budgets at both the state and local levels are impacted funding for programs related to high school exit exams, such as remediation services.
The performance of students with disabilities across the states with exit exams varies greatly and, since each state administers a unique exam or series of exams, results are not comparable across states. However, a look at the pass rates of students with disabilities compared to all students within states provides a glimpse of the impact these exams are having on a significant portion of the nation’s 5.8 million school-age students with disabilities, 72% of whom are educated in states with exit exams currently in place. See the State-by-State Performance At a Glance section for more information.
The consequences of these high stakes exit exams for students with disabilities are neither well researched nor well understood. However, in a 2005 Information Brief, the National Center on Secondary Education and Transition laid out the following consequences of requiring students with disabilities to pass state exit exams to receive a standard high school diploma:
Intended consequences:
- More students with disabilities will participate in the general education curriculum and achieve results.
- Higher academic expectations will improve students’ access to postsecondary education and employment.
- The differences between general education and special education students are reduced—all students are held to the same standards, are required to pass the same exams, and receive the same diploma.
- Exit exams signify a minimum standard for all students to achieve—holding all students to these standards gives clearer meaning and value to diplomas earned.
- Educators will use differentiated instructional strategies, including the use of accommodations, to assist students in meeting higher academic standards and passing exit exams.
Unintended consequences:
- Some students with disabilities will fail to receive standard diplomas.
- Higher dropout rates may result as students’ frustrations rise amid difficulties in passing exit exams.
- Student self-esteem is lowered by repeated failures on exit exams.
- Dissatisfaction and conflicts with parents may sometimes result; possibilities for lawsuits may also occur.
- Some students may need to remain in school longer to meet the requirements of standard diplomas.
- States and LEAs may be forced to create alternative diplomas and pathways to ensure that students exit with some form of high school exit credential.
Advice to Advocates & Parents
Advocates and parents should become involved in the policies developed by states regarding exit exams to ensure that such policies are fair and equitable for students with disabilities. While the right of states to impose high stakes exams has been well established through several court cases, it is imperative that it be done so in a nondiscriminatory manner. Do No Harm, a 2001 report examining the needs and rights of students with learning disabilities with regard to high-stakes standardized tests, identified essential elements of a fair and nondiscriminatory assessment system for students with learning and other disabilities that can be used as a checklist by advocates and parents.
Essential Elements of a Fair and Nondiscriminatory Assessment System
- Lead Time: Sufficient advance time (4-6 years) so that students with learning disabilities will not be negatively impacted by an assessment system.
- Validity: An assessment system which actually tests what it was designed to measure and only for purposes and categories of students that have been validated.
- Testing What Was Taught: Guarantees that students are actually tested on material that they have learned in the classroom.
- Accommodations: Allowable accommodations that include any accommodation previously used and is listed in a student's IEP or Section 504 Plan.
- Parent Involvement: Decision making about a student's participation in the assessment system by IEP and Section 504 teams.
- Test Ability, Not Disability: Examinations that do not test a student's learning disability (e.g., tests that are required to be handwritten or that heavily emphasize spelling).
- Limit on High Stakes Test Use: Rarely, if ever, should standardized tests be given high-stakes consequences for students with disabilities.
- Alternate Assessments: Alternate assessments that allow learning disabled students to demonstrate their knowledge, rather than the effects of their disabilities.
- Appeal Procedures: Procedural safeguards to ensure that students are able to contest decisions about accommodations, alternate assessments, and scores on assessments.
- Information: Provision to students and parents of clear and accurate information about the assessment system, accommodations, alternate assessments, and appeals.
- No One Measure: Multiple measures of student performance utilized in the assessment system
STATE-BY-STATE PERFORMANCE AT A GLANCE
The snapshots below are drawn from the state profiles produced by CEP as part of its December 2010 report, State High School Tests: Exit Exams and Other Assessments. The CEP state profiles provide a wealth of detailed information about each state’s exit exam(s). Readers are encouraged to download the full state profile (available in WORD format) for additional information.
ALABAMA
(Educates 1.3% of all students with disabilities) |
Percentage of Students Passing By End of 12th Grade*
2009-2010 School Year
*see state profile for Science and Social Studies pass rates |
Does State Offer Alternate Paths to Graduation? |
Download full CEP state profile |
All Students |
Students with Disabilities |
Reading |
Language Arts |
Math |
Reading |
Language Arts |
Math |
94% |
91% |
95% |
53% |
50% |
60% |
Yes |
Alabama |
ALASKA
(Educates 0.3% of all students with disabilities) |
Percentage of Students Passing on First Try in 10th Grade
2009-2010 School Year |
Does State Offer Alternate Paths to Graduation? |
Download full CEP state profile |
All Students |
Students with Disabilities |
Reading |
Writing |
Math |
Reading |
Writing |
Math |
84% |
74% |
77% |
45% |
29% |
35% |
Yes |
Alaska |
ARIZONA
(Educates 1.9% of all students with disabilities)
|
Percentage of Students Passing By End of 12th Grade
2009-2010 School Year |
Does State Offer Alternate Paths to Graduation? |
Download full CEP state profile |
All Students |
Students with Disabilities |
Reading/
Language Arts |
Writing |
Math |
Reading/
Language Arts |
Writing |
Math |
92% |
92% |
87% |
51% |
53% |
34% |
Yes; Students with disabilities may also be exempted. |
Arizona |
ARKANSAS
(Educates 0.9% of all students with disabilities) |
Percentage of Students Passing on First Attempt
2009-2010 School Year |
Does State Offer Alternate Paths to Graduation? |
Download full CEP state profile |
All Students |
Students with Disabilities |
Algebra I |
Algebra I |
92% |
72% |
Students with disabilities may graduate based on their IEP. |
Arkansas |
CALIFORNIA
(Educates 10.5% of all students with disabilities)
|
Percentage of Students Passing By End of 12th Grade
2008-2009 School Year |
Does State Offer Alternate Paths to Graduation? |
Download full CEP state profile |
All Students |
Students with Disabilities |
Reading/
Language Arts |
Math |
Both |
Reading/
Language Arts |
Math |
Both |
95.8% |
95.4% |
93.4% |
68.8% |
65.5% |
N/A |
Yes; See full CEP state profile for details. |
California |
FLORIDA
(Educates 5.9% of all students with disabilities) |
Percentage of Students Passing on First Try in 10th Grade
2009-2010 School Year |
Does State Offer Alternate Paths to Graduation? |
Download full CEP state profile |
All Students |
Students with Disabilities |
Reading |
Math |
Reading |
Math |
60% |
84% |
24% |
50% |
Yes; in addition, students with disabilities are identified as eligible for a waiver through the IEP process. |
Florida |
GEORGIA
(Educates 2.8% of all students with disabilities) |
Percentage of Students Passing on First Try in 11th Grade*
2008-2009 School Year
*see state profile for Science and Social Studies pass rates |
Does State Offer Alternate Paths to Graduation? |
Download full CEP state profile |
All Students |
Students with Disabilities |
Writing |
Language Arts |
Math |
Writing |
Language Arts |
Math |
91% |
92% |
95% |
59% |
60% |
66% |
No; but students with disabilities can apply for waiver. |
Georgia |
IDAHO
(Educates 0.4% of all students with disabilities) |
Percentage of Students Passing on First Try in 10th Grade
2009-2010 School Year |
Does State Offer Alternate Paths to Graduation? |
Download full CEP state profile |
All Students |
Students with Disabilities |
Reading |
Language Arts |
Math |
Reading |
Language Arts |
Math |
86% |
72% |
77% |
43% |
22% |
27% |
No; but students with disabilities may appeal for an alternate measure to reach graduation. |
Idaho |
INDIANA
(Educates 2.7% of all students with disabilities) |
Percentage of 10th Graders Passing on First Try
2008-2009 School Year |
Does State Offer Alternate Paths to Graduation? |
Download full CEP state profile |
All Students |
Students with Disabilities |
English Language Arts |
Math |
English Language Arts |
Math |
67% |
65% |
23% |
27% |
Yes; See full CEP state profile for details. |
Indiana |
LOUISIANA
(Educates 1.3% of all students with disabilities) |
Percentage of Students Passing on First Try in 10th Grade*
2009-2010 School Year
*see state profile for Science and Social Studies pass rates |
Does State Offer Alternate Paths to Graduation? |
Download full CEP state profile |
All Students |
Students with Disabilities |
English Language Arts |
Math |
English Language Arts |
Math |
88% |
87% |
54% |
62% |
Yes; See full CEP state profile for details. |
Louisiana |
MARYLAND
(Educates 1.6% of all students with disabilities) |
Percentage of Students Passing by the End of 12th Grade*
2008-2009 School Year
*see state profile for Biology and Government pass rates |
Does State Offer Alternate Paths to Graduation? |
Download full CEP state profile |
All Students |
Students with Disabilities |
English 2 |
Algebra |
ALL* |
English 2 |
Algebra |
ALL* |
86.6% |
88.8% |
92.5% |
55.6% |
60.6% |
68.8% |
No; but students with disabilities have alternate assessment options. |
Maryland |
MASSACHUSETTS
(Educates 2.6% of all students with disabilities) |
Percentage of Students Passing by the End of 12th Grade* 2008-2009 School Year
*see state profile for science and technology/engineering (STE) pass rates |
Does State Offer Alternate Paths to Graduation? |
Download full CEP state profile |
All Students |
Students with Disabilities |
English Language Arts |
Math |
BOTH |
English Language Arts |
Math |
BOTH |
97% |
97% |
96% |
85% |
83% |
82% |
Yes; See full CEP state profile for details. |
Massachusetts |
MINNESOTA
(Educates 1.9% of all students with disabilities) |
Percentage of Students Passing on First Try
2009-2010 School Year |
Does State Offer Alternate Paths to Graduation? |
Download full CEP state profile |
All Students |
Students with Disabilities |
Reading |
Writing |
Math |
Reading |
Writing |
Math |
78% |
90% |
58% |
39% |
62% |
15% |
Yes; See full CEP state profile for details. |
Minnesota |
MISSISSIPPI
(Educates 0.9% of all students with disabilities) |
Percentage of Students Passing by the End of 12th Grade*
2009-2010 School Year
*see state profile for Biology I and U.S. History pass rates |
Does State Offer Alternate Paths to Graduation? |
Download full CEP state profile |
All Students |
Students with Disabilities |
English II |
Algebra I |
ALL* |
English II |
Algebra I |
ALL* |
87.7% |
88.4% |
89.8% |
30.1% |
35.7% |
35.9% |
No; See full CEP state profile for details. |
Mississippi |
NEVADA
(Educates 0.7% of all students with disabilities) |
Percentage of Students Passing by the End of 12th Grade
2009-2010 School Year |
Does State Offer Alternate Paths to Graduation? |
Download full CEP state profile |
All Students |
Students with Disabilities |
Reading |
Writing |
Math |
Reading |
Writing |
Math |
70.23% |
78.41% |
55.32% |
37.41% |
38.10% |
19.13% |
No; See full CEP state profile for details. |
Nevada |
NEW JERSEY
(Educates 3.7% of all students with disabilities) |
Percentage of Students Passing |
Does State Offer Alternate Paths to Graduation? |
Download full CEP state profile |
All Students |
Students with Disabilities |
At this time New Jersey is unable to verify or report initial or cumulative pass rates. |
Yes, and some students with disabilities are exempt from passing. |
New Jersey |
NEW MEXICO
(Educates 0.7% of all students with disabilities)
|
Percentage of Students Passing By End of 12th Grade*
2009-2010 School Year
*see state profile for Writing, Science and Social Studies pass rates |
Does State Offer Alternate Paths to Graduation? |
Download full CEP state profile |
All Students |
Students with Disabilities |
Reading |
Language Arts |
Math |
Reading |
Language Arts |
Math |
96.8% |
95.0% |
95.1% |
83.6% |
77.3% |
76.3% |
Yes |
New Mexico |
NEW YORK
(Educates 6.9% of all students with disabilities) |
Percentage of Students Passing |
Does State Offer Alternate Paths to Graduation? |
Download full CEP state profile |
All Students |
Students with Disabilities |
At this time New York is unable to verify or report initial or cumulative pass rates. |
Yes |
New York |
NORTH CAROLINA
(Educates 2.9% of all students with disabilities) |
Percentage of Students Passing by the End
of 12th Grade*
2009-2010 School Year
*see state profile for Biology, Civics/Economics and
U.S. History pass rates |
Does State Offer Alternate Paths to Graduation? |
Download full CEP state profile |
All Students |
Students with Disabilities |
English I |
Algebra I |
English I |
Algebra I |
82% |
78% |
50% |
61% |
Yes; See full CEP state profile for details. |
North Carolina |
OHIO
(Educates 4.2% of all students with disabilities) |
Percentage of Students Passing on First Try
2008-2009 School Year
*see state profile for Science and Social Studies pass rates |
Does State Offer Alternate Paths to Graduation? |
Download full CEP state profile |
All Students |
Students with Disabilities |
Reading |
Writing |
Math |
Reading |
Writing |
Math |
95% |
95% |
92% |
70% |
72% |
62% |
No; See full CEP state profile for details. |
Ohio |
OKLAHOMA
(Educates 1.5% of all students with disabilities) |
Percentage of Students Passing on First Attempt
2009-2010 School Year
*see state profile for Algebra II, Geometry, English III,
Biology and U.S. History pass rates |
Does State Offer Alternate Paths to Graduation? |
Download full CEP state profile |
All Students |
Students with Disabilities |
English II |
Algebra I |
ALL* |
English II |
Algebra I |
ALL* |
81% |
75% |
74% |
60% |
66% |
49% |
Yes; See full CEP state profile for details. |
Oklahoma |
OREGON
(Educates 1.2% of all students with disabilities) |
Percentage of Students Passing |
Does State Offer Alternate Paths to Graduation? |
Download full CEP state profile |
All Students |
Students with Disabilities |
Because Oregon’s policies are new, there are no student performance data to report at this time. |
Yes, same as for all students |
Oregon |
RHODE ISLAND
(Educates 0.4% of all students with disabilities) |
Percentage of Students Passing |
Does State Offer Alternate Paths to Graduation? |
Download full CEP state profile |
All Students |
Students with Disabilities |
Because Rhode Island’s policies are new, there are no student performance data to report at this time. |
To be determined. |
Rhode Island |
SOUTH CAROLINA
(Educates 1.6% of all students with disabilities) |
Percentage of Students Passing on First Try in 10th Grade
2008-2009 School Year |
Does State Offer Alternate Paths to Graduation? |
Download full CEP state profile |
All Students |
Students with Disabilities |
English Language Arts |
Math |
English Language Arts |
Math |
85% |
80% |
43% |
36% |
No |
South Carolina |
TENNESSEE
(Educates 1.8% of all students with disabilities) |
Percentage of Students Passing by the End of 12th Grade
2009-2010 School Year |
Does State Offer Alternate Paths to Graduation? |
Download full CEP state profile |
All Students |
Students with Disabilities |
English II |
Algebra I |
Biology |
English II |
Algebra I |
Biology |
95.0% |
74.6% |
95.3% |
78.3% |
48% |
81.3% |
No; See full CEP state profile for details. |
Tennessee |
TEXAS
(Educates 7.0% of all students with disabilities) |
Percentage of Students Passing by End of 12th Grade*
2009-2010 School Year
*see state profile for Science and Social Studies pass rates |
Does State Offer Alternate Paths to Graduation? |
Download full CEP state profile |
All Students |
Students with Disabilities |
English Language Arts |
Math |
ALL* |
English Language Arts |
Math |
ALL* |
97% |
92% |
90% |
75% |
52% |
49% |
Yes; See full CEP state profile for details. |
Texas |
VIRGINIA
(Educates 2.6% of all students with disabilities)
|
Percentage of Students Passing on First Attempt*
2009-2010 School Year
*see state profile for Algebra II, Geometry, Earth Science, Biology, Chemistry, World History I, II, VA/US History and World Geography pass rates |
Does State Offer Alternate Paths to Graduation? |
Download full CEP state profile |
All Students |
Students with Disabilities |
English/
Reading |
English/
Writing |
Algebra I |
English/
Reading |
English/
Writing |
Algebra I |
94% |
92% |
94% |
75% |
67% |
81% |
Yes; See full CEP state profile for details. |
Virginia |
WASHINGTON
(Educates 1.9% of all students with disabilities) |
Percentage of Students Passing by End of 12th Grade
2008-2009 School Year |
Does State Offer Alternate Paths to Graduation? |
Download full CEP state profile |
All Students |
Students with Disabilities |
Reading
and Writing |
Reading, Writing and Math |
Reading
and Writing |
Reading, Writing and Math |
93.5% |
72.0% |
84.7% |
58.1% |
Yes; See full CEP state profile for details. |
Washington |
|