Inclusion and Graduation Rates: What Are the Outcomes?
Researchers
Janet I. Goodman, Michael Hazelkorn, Jessica L. Bucholz, Mary Lou Duffy, and Yayoi Kitta examined the impact of inclusion on high school graduation rates.
This study is important given the push toward inclusion brought about by recent updates to the Individuals with Disabiities Education Act (IDEA) as well as the No Child Left Behind Act, the current version of the Elementary and Secondary Education Act (ESEA). Both laws emphasize access to the general curriculum and heighten the achievement of students with disabilities as compared to other students.
The topic is also important because of the high stakes attached to earning a regular high school diploma. Students with disabilities continue to evidence unacceptably high drop-out rates and low graduation rates. Yet we know that:
- Students who do not complete high school are at increased risk for lower wages, higher rates of
Median personal income
according to education levels
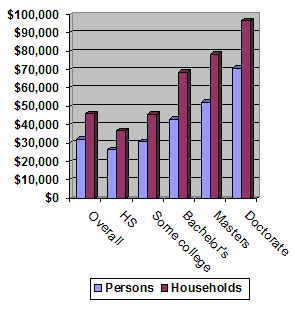
Source: U.S. Census Bureau, 2004/06
|
incarceration, and less access to postsecondary education;
- High school drop-outs earn on average $270,000 less than high school graduates and a million dollars less than college graduates over their working lives;
- Without a high school diploma, options are severely limited for postsecondary career success.
This study examined the records of 67,749 students with mild disabilities in Georgia during a 6-year period to determine the effects of inclusion (i.e., the amount of time spent in general education classrooms) on graduation rates. The study compared the number of students at the end of eighth grade for the 1999 to 2004 school years to the number of students graduating in that same cohort 4 years later, from 2004 to 2008.
For purposes of the study, "mild disabilities" were defined as students with specific learning disabilities (SLD), emotional and behavioral disorders (EBD), mild intellectual disabilities (MID), and other health impairments (OHI).
The study defined "inclusion" as an educational environment where the a student spends at least 80% or more of the school day in general education.
FINDINGS
1. Inclusion percentages for all students with mild disabilities in eight grade went from 28.0% in 2003 to 38.2% in 2008. For 12-graders with mild disabilities, the inclusion rate went from 44.5% to 62.1%. Inclusion rates by disability category were as follows:
For 8th-grade students with SLD, the inclusion rate went from 39.4% in 2003 to 49.8% in 2008.
For 8th-grade students with EBD, the inclusion rate went from 24.2% in 2003 to 33.3% in 2008.
For 8th-grade students with MID, the inclusion rate went from 6.6% in 2003 to 11.6% in 2008.
for 8th-grade students with OHI, the inclusion rate went from 28.8% in 2003 to 39.2% in 2008.
For 12th-grade students with SLD, the inclusion rate went from 61.2% in 2003 to 74.5% in 2008.
For 12th-grade students with EBD, the inclusion rate went from 39.0% in 2003 to 61.8% in 2008.
For 12th-grade students with MID, the inclusion rate went from 12.3% in 2003 to 27.8% in 2008.
for 12th-grade students with OHI, the inclusion rate went from 50.7% in 2003 to 66.2% in 2008.
These increased rates of inclusion across disability categories showed that a concerted effort had been made to increase the inclusion rate in the state.
2. The graduation rate for all students with mild disabilities went from 26.8% in 2003 to 26.7% in 2008. Graduation rates varied for each disability category as follows:
Graduation rate for students with SLD decreased from 37.1% to 36.1%.
Graduation rate for students with
EBD increased from 15.6% to 16.6%.
Graduation rate for students with
MID decreased from 4.6% to 3.8%.
Graduation rate for students with OHI decreased from 48.8% to 36.3%.
THE
BOTTOM LINE
These results show that as inclusion increases from Grade 8 to Grade 12 for all disabilities, the graduation rate stays stable or decreases. Graduation rates for students without disabilities during this same time increased from 70.8% to 78.9%.
DISCUSSION
The researchers point out that one barrier to graduation for students with disabilities may be the state's standardized graduation test requirements. Since the onset of high-stakes exit exams, researchers have posited that such exams have produced higher rates of dropouts of secondary-level students with disabilities as well as other students who consider themselves unlikely to pass such tests. Furthermore, although inclusion has many benefits, it is not clear whether the benefits outweigh the consequences for those who cannot meet the requirements necessary for a standard high school diploma.
The researchers conclude that "the data from this study seem to indicate that students with disabilities do not have the same chances of graduating as any other student. Although laws continue to be written to ensure that students with disabilities receive an individualized and free and appropriate public education, data show that they in fact are not receiving the same opportunities as students without disabilities. As graduation requirements are standardized and diploma options are limited, individual options for specialized instruction are being eliminated."
Furthermore, as the researchers point out, "although the special education literature is replete with effective strategies and interventions to use with students with disabilities in inclusive settings, there seems to be a disconnect between best practices and implementation as evidenced by the low graduation rates for students with mild disabilities inclusion."
Therefore, "federal and state policy makers should be aware that policies regarding inclusive as the primary placement for students with disabilities to receive access to the general curriculum do not necessarily bring about successful results."
The Research: Inclusion and Graduation Rates: What Are the Outcomes?, Janet I. Goodman, Michael Hazelkorn, Jessica L. Bucholz, Mary Lou Duffy, and Yayoi Kitta, Journal of Disability Policy Studies 21 (4) 241-252, Hammill Institute on Disabilities, 2011.
|