Graduation Rate for Students with Disabilities Varies Widely Across States
The U.S. Dept. of Education has released the first round of high school graduation rate data compiled based upon the common measure known as the “four-year adjusted cohort rate” required by a 2008 federal regulation.
The four-year adjusted cohort graduation rate is the number of students who graduate in four years with a regular high school diploma divided by the number of students who form the adjusted cohort for the graduating class. From the beginning of 9th grade (or the earliest high school grade), students who are entering that grade for the first time form a cohort that is “adjusted” by adding any students who subsequently transfer into the cohort and subtracting any students who subsequently transfer out, emigrate to another country, or die.
For the first time, graduation rates can be compared across states and across student groups, such as students with disabilities. Graduation rate data for all states and all student groups is available here.
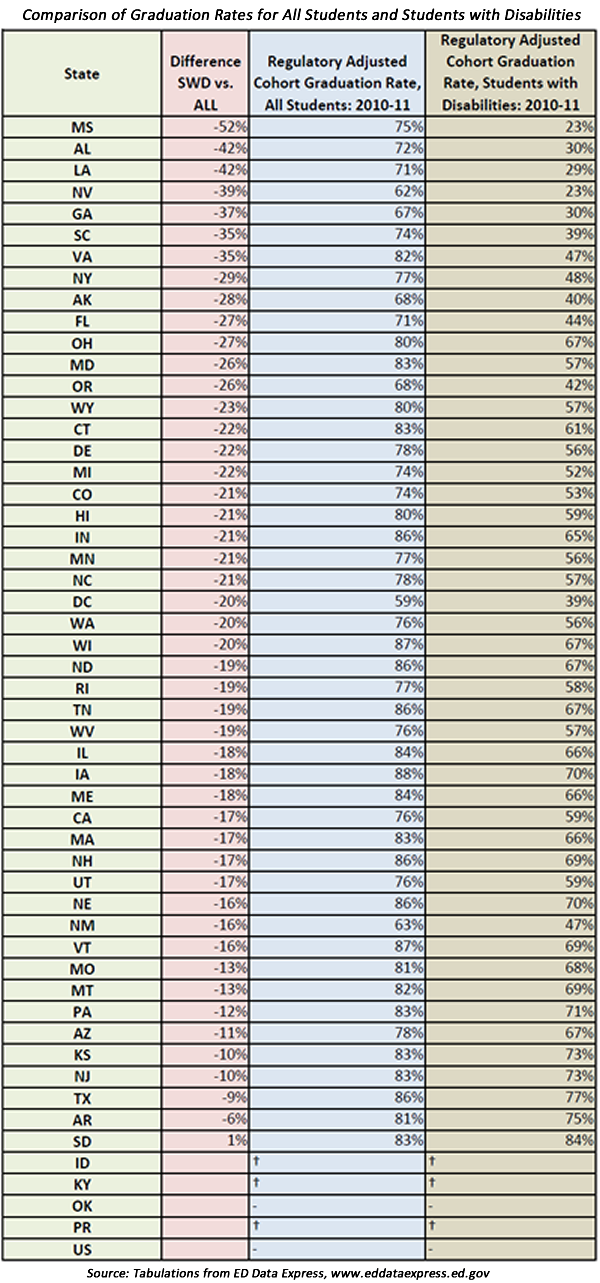
Below is a comparison of the graduation rate for all students and students with disabilities by state (note: data for ID, KY, OK, and PR are not available).
Some highlights:
- Graduation rates for students with disabilities range from a high of 84% (SD) to a low of 23% (MS and NV)
- Mississippi has the largest gap in graduation rates at 52%
- Seven states have graduation gaps of 35% or greater (MS, AL, LA, NV, GA, SC, VA)
- Twenty-five states have graduation gaps of 20% or greater